A complete FTIR spectrum analysis tool for students, researchers, and lab professionals. Evidence-led peak assignment with confirmatory correlation. Available on iPhone, iPad, and Mac.
£3.99 one-time purchase. No subscription. No data collected. No catch.


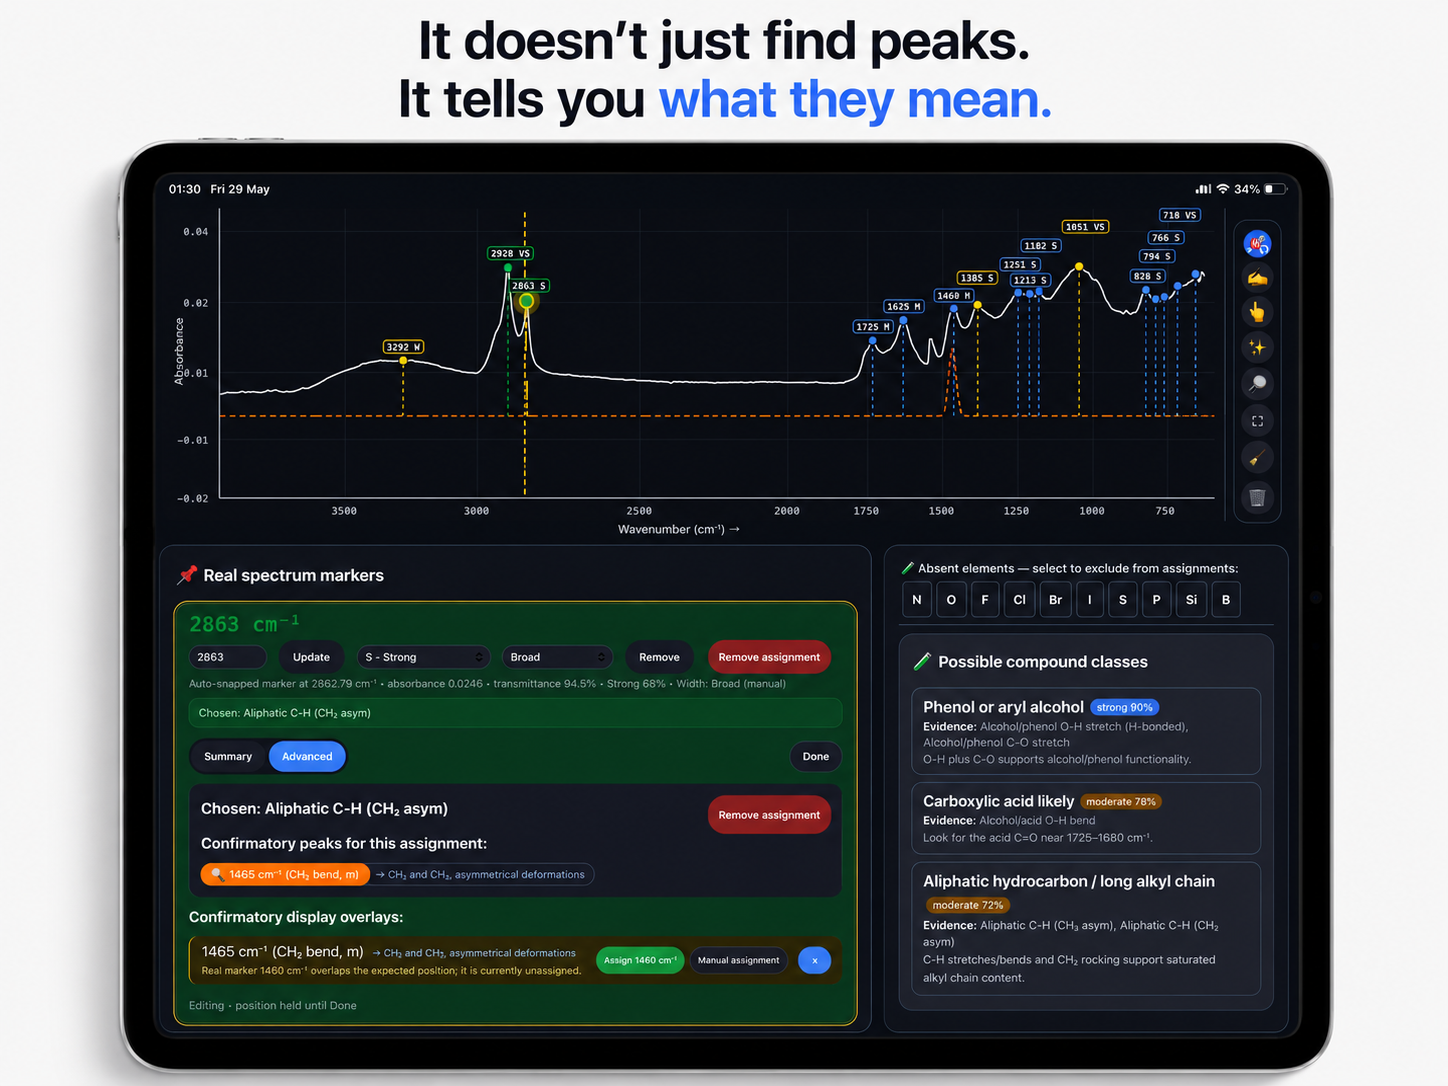
Swano's FTIR Interpretation Assistant is an evidence-led infrared spectrum analysis tool built by an industrial analytical chemist. Rather than simply matching a single wavenumber to a database, it encourages confirmatory correlation — assigning carbonyl stretches, O-H envelopes, N-H bands, aromatic C=C absorptions, and fingerprint region peaks as patterns of mutually supporting evidence. The app has three distinct modes, each designed for a different workflow.
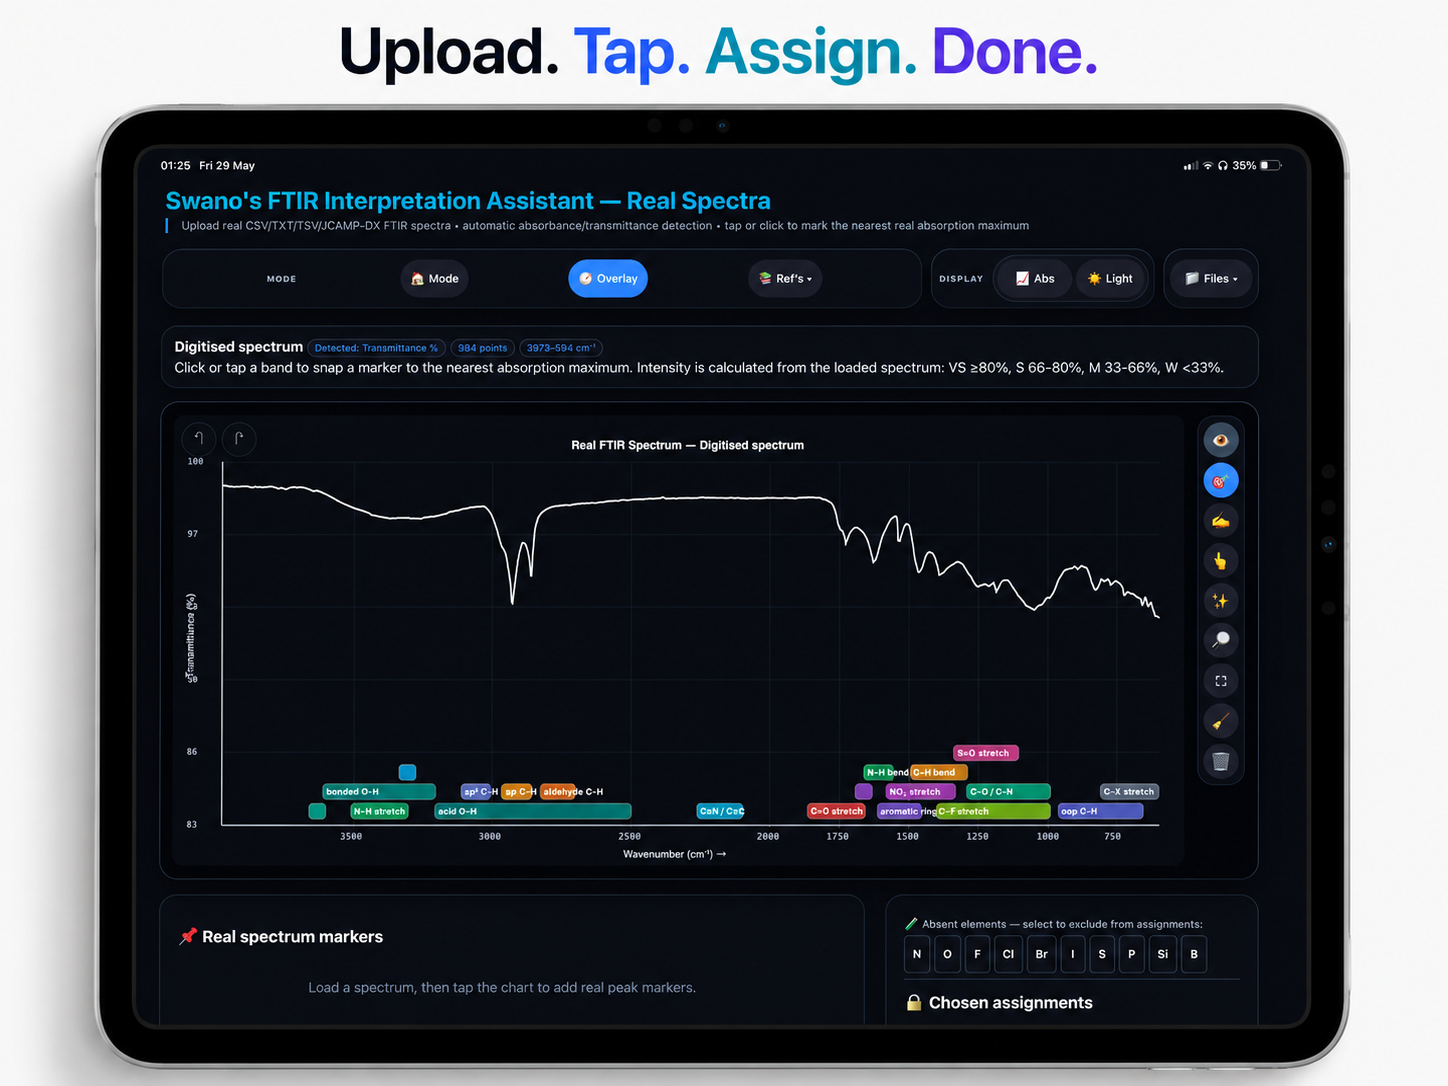
Upload a CSV, TSV, TXT, or JCAMP-DX file exported directly from your spectrometer. The app auto-detects absorbance or transmittance, lets you tap peaks to mark them, and suggests functional group assignments with confirmatory evidence. Supports files from Bruker, PerkinElmer, Shimadzu, Agilent, Thermo Fisher and other FTIR instruments.
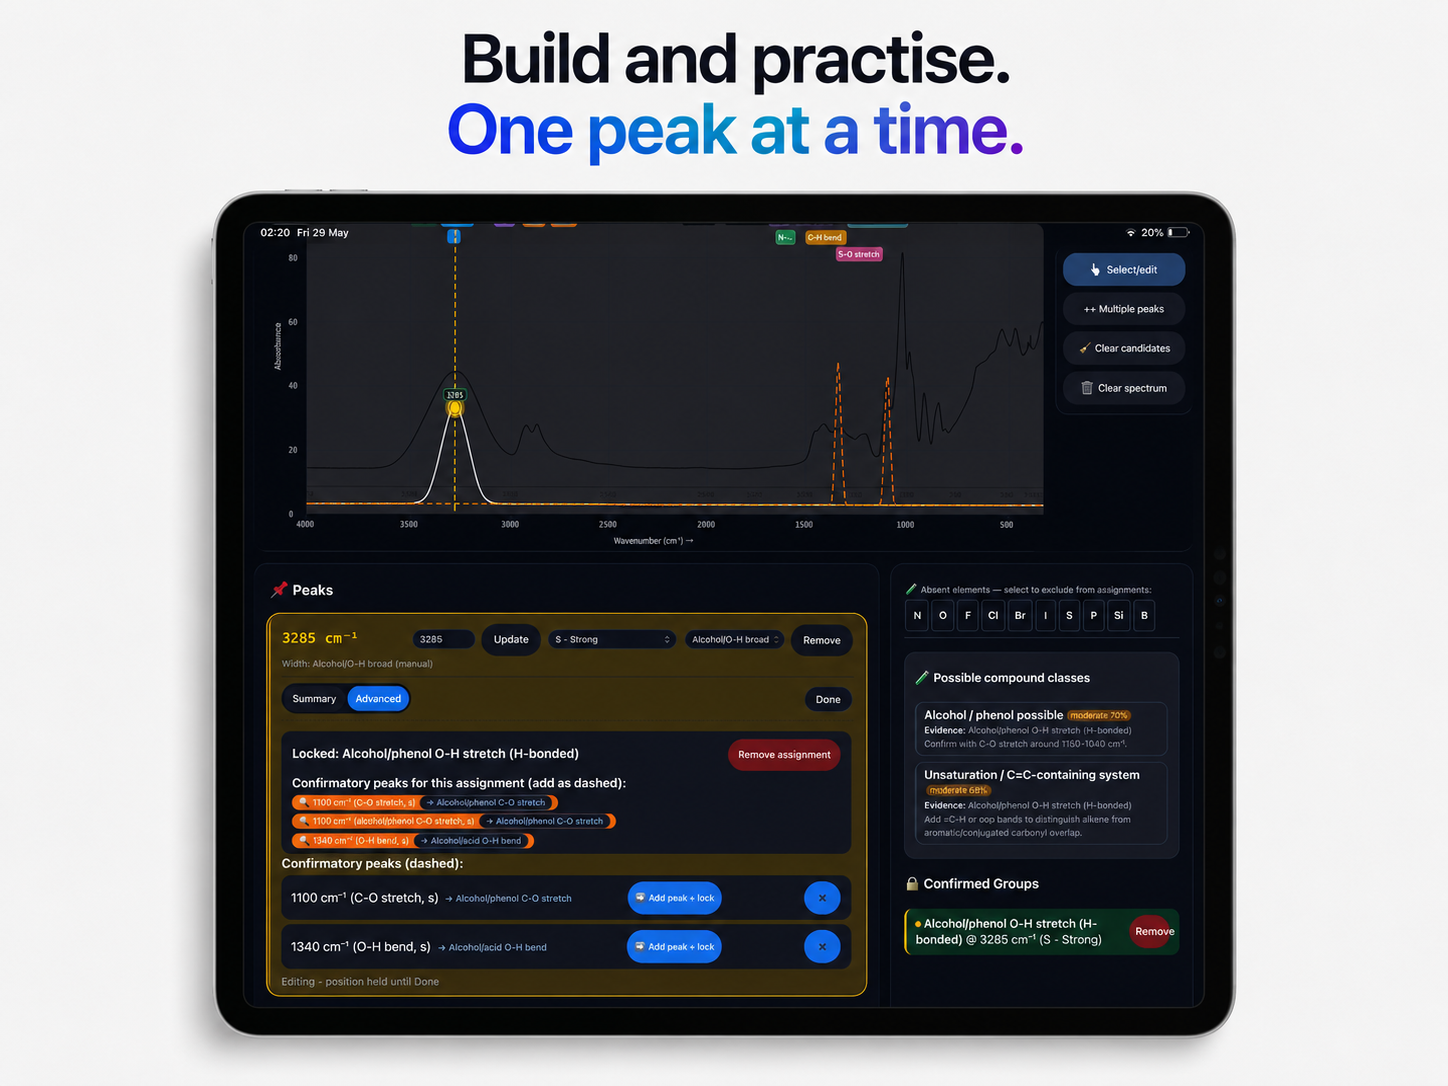
Build theoretical spectra by placing Gaussian peaks manually at known wavenumbers. Ideal for teaching, practising assignments, or exploring how overlapping bands look in the fingerprint region. Add confirmatory peaks, lock assignments, and export annotated PDF reports for coursework or handouts.
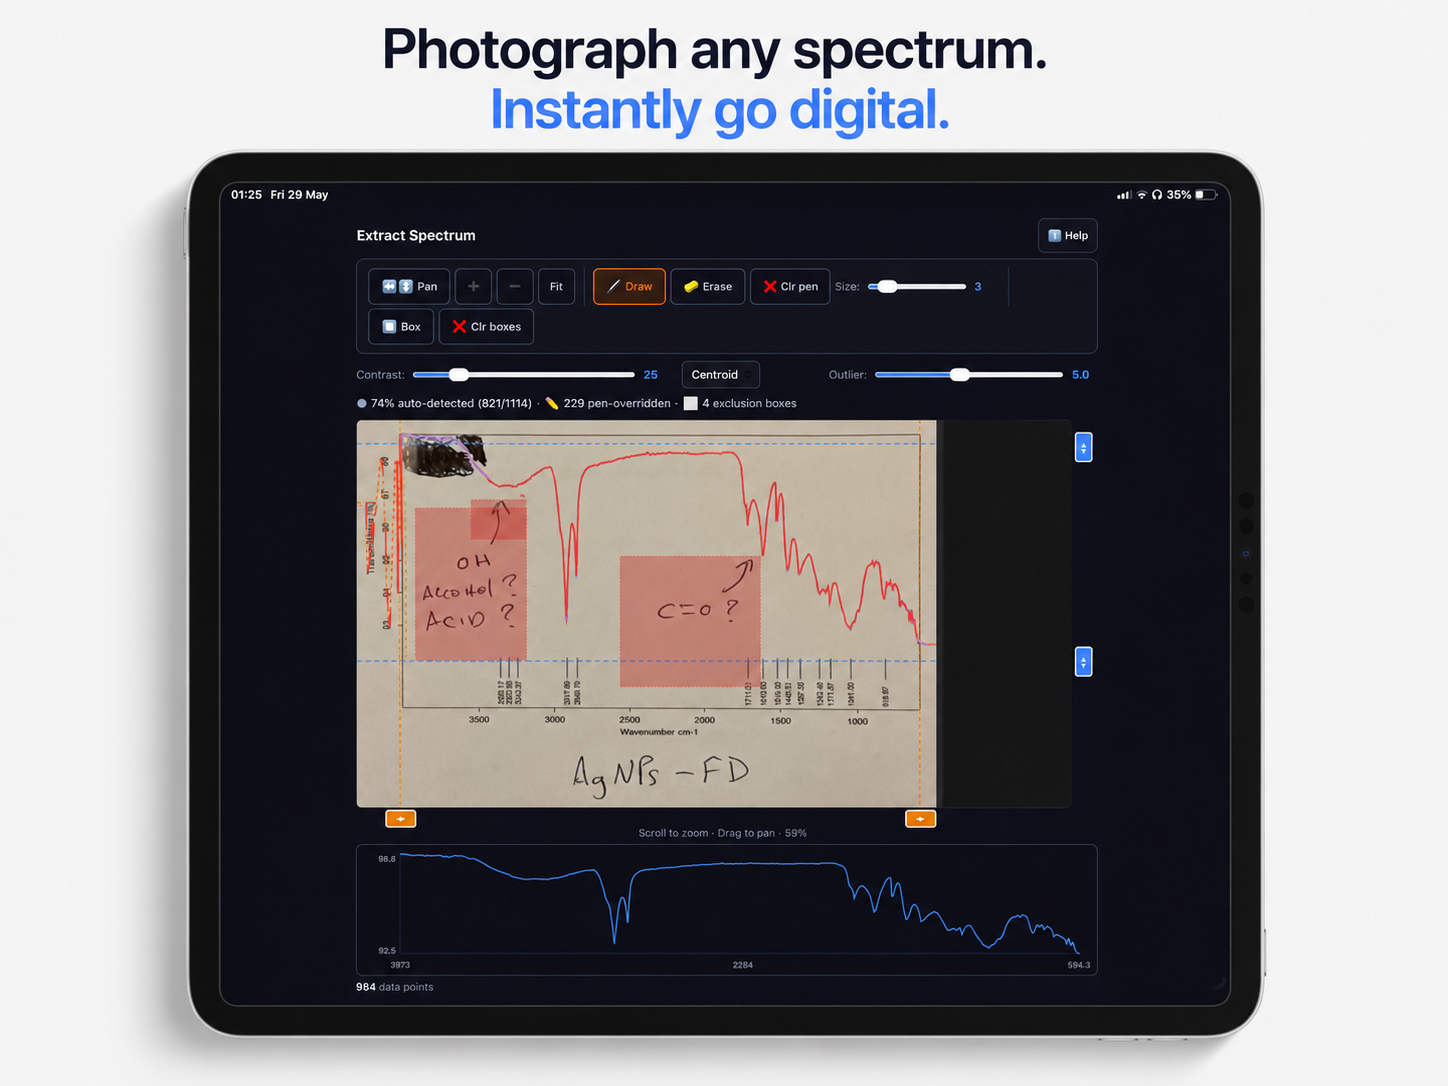
Photograph or scan a printed FTIR spectrum from a paper, textbook, or photocopied report. Apply perspective correction to remove tilt and distortion, calibrate the wavenumber axis against known tick marks, then extract the digital trace and open it directly in Real Spectra mode for full peak assignment.
Real Spectra mode accepts instrument data directly — no conversion needed for most FTIR instruments. The app reads wavenumber and intensity columns automatically and handles both absorbance and transmittance spectra.
Tap Files → Upload spectrum and choose a CSV, TSV, TXT, or JCAMP-DX (.jdx / .dx) file. The app reads wavenumber and intensity columns automatically and detects whether the data is absorbance or transmittance.
Tap anywhere on the spectrum chart. Assisted pick snaps to the nearest detected absorption maximum. Manual pick places a marker exactly where you tap — useful for broad O-H envelopes, carboxylic acid absorptions, or shoulders that don't form a clean maximum.
Each marker shows a ranked list of functional-group candidates based on wavenumber, intensity, and band shape. Tap a suggestion to lock it as your assignment. Confirmatory evidence highlights related bands elsewhere in the spectrum that support or challenge the assignment.
Use the element-exclusion bar to mark atoms absent from your sample (e.g. N, S, halogens). The app filters out assignments that require those elements, sharpening the candidate list to what is chemically possible.
Tap Files → Save TSV to save the session in a format you can reload later. Tap Files → Export Report to generate a PDF chart with all assignments, wavenumber positions, and confirmatory evidence suitable for lab reports or coursework.
The Digitiser lets you recover numerical data from any printed, photocopied, or published FTIR spectrum image — including spectra photographed at an angle. Perspective correction removes keystoning and tilt before calibration, giving more accurate wavenumber extraction than tools that require a pre-corrected flat image.
Tap Choose image to pick a photo from your library, or use Take photo to photograph a printed or photocopied spectrum directly with your iPhone or iPad camera.
Drag the four coloured corner handles to match the corners of the spectrum plot area. This removes any tilt or keystone distortion from the photograph — essential for accurate wavenumber calibration.
Tap known wavenumber positions on the X axis (e.g. 4000, 3000, 2000, 1000 cm⁻¹) and enter the corresponding values. A minimum of two points is required; more calibration points improve accuracy for non-linear or compressed axes.
Tap the top and bottom of the Y axis scale and enter the corresponding absorbance or transmittance values.
Tap Extract spectrum to digitise the trace, then Open in Real Mode to transfer the data directly into Real Spectra mode for full peak assignment and functional group analysis. Or tap Download CSV to save the raw wavenumber/intensity data.
Real Spectra mode accepts data files exported from most modern FTIR spectrometers. The app reads wavenumber and intensity columns automatically with no manual configuration required for standard exports.
OPUS software exports — convert to JCAMP-DX (.jdx) or CSV from within OPUS before importing.
Spectrum software exports to CSV and JCAMP-DX directly. Both formats are supported.
IRSolution and LabSolutions IR export to CSV and JCAMP-DX (.jdx / .dx).
Resolutions Pro and MicroLab software export to CSV and JCAMP-DX formats.
OMNIC software supports JCAMP-DX export. Use File → Save As → JCAMP-DX.
Any two-column wavenumber/intensity text file works — CSV, TSV, or space-delimited TXT with or without headers.
Supported file formats:
Real Spectra mode accepts:
The app auto-detects absorbance vs transmittance. If detection is wrong, use Display → Source format to override it manually.
Most modern FTIR software supports CSV or JCAMP-DX export:
If your instrument software doesn't export CSV directly, JCAMP-DX is supported by almost all FTIR instruments and is the recommended format.
In Real Spectra mode, tap Files → Save session TSV. The saved file includes your spectrum data, all markers, and all assignments. To reload it, tap Files → Upload spectrum and open the saved TSV.
In Sandbox mode, tap Files → Save session to export a JSON file with all your peaks and assignments.
Accuracy depends on image quality and the number of calibration points used. For best results:
For peer-reviewed work, always verify digitised data against the original published figure.
Yes. In Real Spectra mode, tap Files → Load reference spectrum. The reference trace is overlaid on the same chart in a contrasting colour. This is useful for comparing an unknown sample to a known compound, a literature spectrum, or a previous batch result.
The element exclusion bar in Real Spectra mode lets you tell the app which atoms are definitely not in your sample. For example, if you know your compound contains no nitrogen, tap N to suppress all amine, amide, nitrile, and nitro assignments from the candidate lists. This narrows the suggestions to what is chemically plausible for your sample.
Tap Files → Export Report in either Real Spectra or Sandbox mode. The app generates a PDF containing the annotated spectrum chart, your peak assignments, wavenumber positions, confirmatory evidence, and compound-class suggestions. You can share it via AirDrop, Mail, or any Files-compatible app — useful for lab reports, coursework submissions, or sharing results with colleagues.
If a spectrum was already open in Real Mode when you tapped Open in Real Mode from the Digitiser, a dialog will appear asking whether to replace the current spectrum or save the digitised data as a CSV. If you see a blank chart after transfer, try tapping ⛶ Fit in the toolbar to reset the zoom to the full wavenumber range.
Yes — completely. All analysis, peak detection, functional group assignment matching, and report generation happens entirely on-device. No internet connection is required at any point and no data is ever sent to a server.
Sandbox mode is designed specifically for teaching and self-study. You can build example spectra from scratch by placing peaks at known wavenumber positions, add confirmatory peaks, lock assignments with colour-coded evidence, and export annotated PDF reports for handouts or coursework. The evidence-led interpretation approach encourages students to think about correlation between bands rather than simply matching a single peak to a table — building proper analytical chemistry reasoning skills.
Swano's FTIR Interpretation Assistant was built by Matthew Swan BSc (Hons) RSci MRSC — an industrial analytical chemist currently studying for an MSc in Analytical Chemistry and Measurement Science. The app grew out of a personal tool for systematic FTIR interpretation and has since developed into a complete teaching and analysis workbench. It is built on real analytical chemistry practice rather than a theoretical database exercise.
Last updated: June 2026
Swano's FTIR Interpretation Assistant does not collect, store, transmit, or share any personal data. All processing happens entirely on your device.
We collect no data whatsoever. Specifically:
The app requests access to your camera and photo library solely to allow you to import spectrum images into the Digitiser. Images are processed locally on your device and are never transmitted or stored outside the app.
Spectrum files you open (CSV, TSV, TXT, JCAMP-DX) and files the app saves (TSV sessions, JSON sessions, PDF reports) remain entirely under your control via the iOS Files app. The app does not retain copies of these files beyond your current session unless you explicitly save them.
The app contains no third-party SDKs, advertising networks, or analytics services. The only framework used is Apple's Capacitor runtime, which is subject to Apple's own privacy practices.
Because no data is collected, the app is safe for users of all ages. It is not directed at children under 13 in any commercial capacity.
If this policy ever changes, an updated version will be posted at this URL. The app will not collect any personal data without clearly notifying you first.
Questions about this privacy policy? Email SwanoFTIR@outlook.com.

Have a question not answered above, found a bug, or have a feature suggestion? We'd love to hear from you.
📧 Email: SwanoFTIR@outlook.com
We aim to respond within 2 business days. For App Store review appeals, please also use the email above and mention "App Store review" in the subject line.